| 新闻来源:科学软件网 发表时间:2024/3/21 17:24:58 |
|
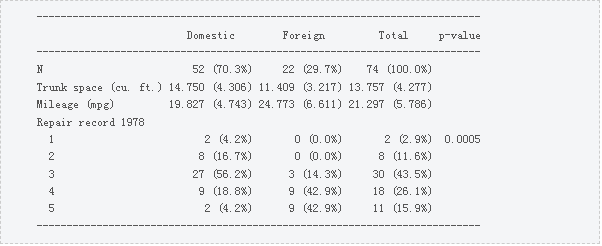
Stata 17和Stata 18中引入的新表格功能使描述性统计、回归结果等表格的创建和定制变得更加容易。这些强大的功能在推出后很快就受到了用户的欢迎,我们经常会收到用户的问题,他们想知道如何定制自己的表格。为了给我们的社区提供更多的学习资源,我们仔细挑选了一些我们经常回答的问题,并将其转化为一系列示例丰富的常见问题解答: https://www.stata.com/support/faqs/reporting/ 下面这个是表格预览,或许你也有这样类似的表格:
但是你想知道如何插入从逻辑回归中获得的p值,从而得到如下表:
你可能还想更改表中某些单元格的字体、样式和背景色,生成一个这样的表:
不确定如何做到这一点。你可以通过阅读FAQ来学习:如何自定义表格以添加单元格阴影、粗体格式和下划线文本?(https://www.stata.com/support/faqs/reporting/change-using-collect-layout/)
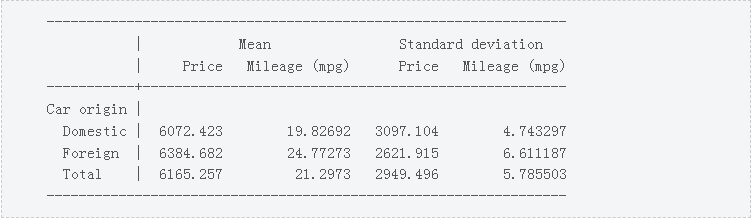
或许你好奇如何更改这个表的布局
更改成这样:
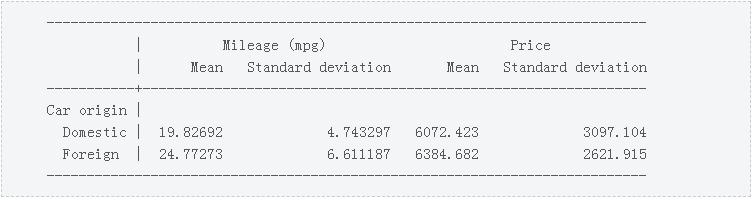
再到这样:
要了解如何操作,你可以阅读FAQ:如何使用集合布局来更改表的布局?(https://www.stata.com/support/faqs/reporting/export-customizable-table-methods/) 除了生成表格以外,我们还在FAQ中提供了如何将表格导出为其他文件格式的指导:我们可以使用哪些方法将可自定义的表从Stata中导出为其他格式?(https://www.stata.com/support/faqs/reporting/export-multiple-tables/)
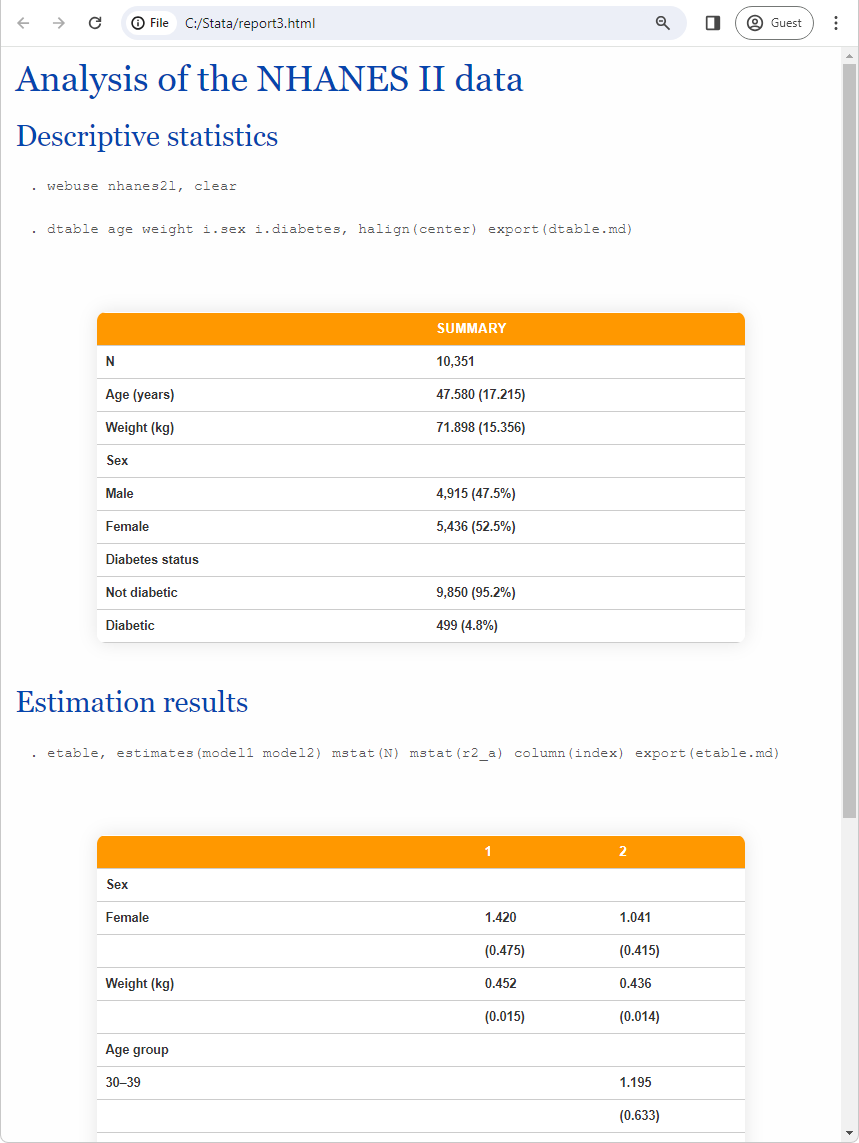
具体地说,要学习如何将多个表导出到一个文件中,这比导出单个表更复杂,你可以阅读FAQ:如何将多张表导出到同一个文件?(https://www.stata.com/support/faqs/reporting/export-multiple-tables/ )在这个FAQ中,我们还演示了如何生成一个具有特殊样式表的HTML文件,该表看起来如下:
还有更多。我们有一系列新的常见问题解答,向你展示如何自定义表格并以各种方式导出它们。 · How to transpose a table generated with collect/table/dtable/etable? · How to reshape a table? https://www.stata.com/support/faqs/reporting/reshape-transpose-tables/ · How can I create table layouts from scratch by using collect get? https://www.stata.com/support/faqs/reporting/collect-get-custom-tables/ · How do I insert a customized statistic in an existing table? · How do I add a new column or a new row in an existing table? https://www.stata.com/support/faqs/reporting/customized-statistic-new-column-row/ · How can I remove rows or columns from a table generated with collect, table, or dtable? https://www.stata.com/support/faqs/reporting/remove-rows-columns-table/ · How do I change a table’s layout using collect layout? https://www.stata.com/support/faqs/reporting/change-using-collect-layout/ · How does dtable handle survey data? · How to generate a table of descriptive statistics for survey data? https://www.stata.com/support/faqs/reporting/dtable-handle-survey-data/ · How can I export multiple tables to one file? https://www.stata.com/support/faqs/reporting/export-multiple-tables/ · Why can’t I observe the style changes (background shading, font, etc.) in my table in the Results window? https://www.stata.com/support/faqs/reporting/style-changes-table-results-window/ · What are the autolevels of a dimension in a table (collection)? https://www.stata.com/support/faqs/reporting/understand-manipulate-table-autolevels/ · Combine multiple tables obtained with table or dtable using collect https://www.stata.com/support/faqs/reporting/combine-multiple-tables/ · What methods can we use to export a customizable table from Stata to another format? https://www.stata.com/support/faqs/reporting/export-customizable-table-methods/ · What file formats are supported when exporting tables from Stata? (.docx, .xlsx, .pdf, .html, .md, .tex, .txt, and .smcl) https://www.stata.com/support/faqs/reporting/export-customizable-table-formats/ · How can I customize my table to add cell shading, bold formatting, and underline texts? https://www.stata.com/support/faqs/reporting/customizing-table-cells/ · How can I easily create and export a table of regression results from Stata to other formats? https://www.stata.com/support/faqs/reporting/export-regression-results-table-formats/ · Which versions of Stata have the table, dtable, etable, and collect commands? https://www.stata.com/support/faqs/reporting/stata-versions-table-commands/ · What official resources are available for learning about the collect/table/etable/dtable commands? https://www.stata.com/support/faqs/reporting/official-resources-available/ 北京天演融智软件有限公司(科学软件网)是STATA软件在中国的授权经销商,为中国的软件用户提供优质的软件销售和培训服务。 |